
Skip to content
RE Line ReportRoody Souverain - RE Line Report
White stucco houses with chimneys and tile roofs at Alys Beach, Florida

RE Line Report · Every Florida ZIP code

Four reports, one rule

You supply the property and the price. We supply the market, with every adjustment written out so you can check it. None of these reports tells you what a house is worth, and each one says so in those words.

Start here

Which one you need depends on which side you are on

The free Market Brief reads an area. The other three read a specific property against the price somebody is asking for it. All four run on the same data and the same scoring, across all 67 Florida counties.

A waterway at Sarasota, Florida, with houses along the far shore and towers beyond

Free · For Anyone

Market Brief

What is actually happening where I am looking?

Your areas, scored against their own pre-pandemic normal rather than a statewide average. How long homes sit, how often sellers cut, whether supply is growing or shrinking, and what that means for the decision in front of you.

What you give it

  • The areas you are weighing
  • What you are trying to do there
  • Your timing

What comes back

  • Every area you picked, scored against its own history
  • Where the price is softest, and where it is tightest
  • What is being built nearby that changes demand
  • A fresh copy every month, from live data

A two-story house behind palms on a street in Hollywood, Florida

From $29/mo · For Buyers

The Offer Line

What should I offer on this house?

You give us the asking price and the details. You get the band the data supports, with every adjustment shown as math you can check, plus what to trade instead of price when the seller will not move.

What you give it

  • The property address or ZIP code
  • The price they are asking
  • The date it was first listed
  • Condition, and anything you know about the seller

What comes back

  • The price band the data supports, line by line
  • What to trade instead of price
  • The next few months, and the next few years
  • The trap on your side of the negotiation

The shape of the table

Five things move the range, and each one prints as its own row with what it is worth in dollars. There are no example figures here on purpose. Every number in a real report is your ZIP code's own, with the source and the date at the end of it.

What moves the numberWhere the figure comes from
Homes in your metro close at this share of askingThe only sold-side figure that exists, named by metro
Sellers here who have already cut their priceYour ZIP now, against the same month in 2018 and 2019
Time to go under contract hereYour ZIP now, against that same baseline
Homes for sale hereYour ZIP now, against that same baseline
This home has been sittingThe date you gave, against what is typical in that ZIP
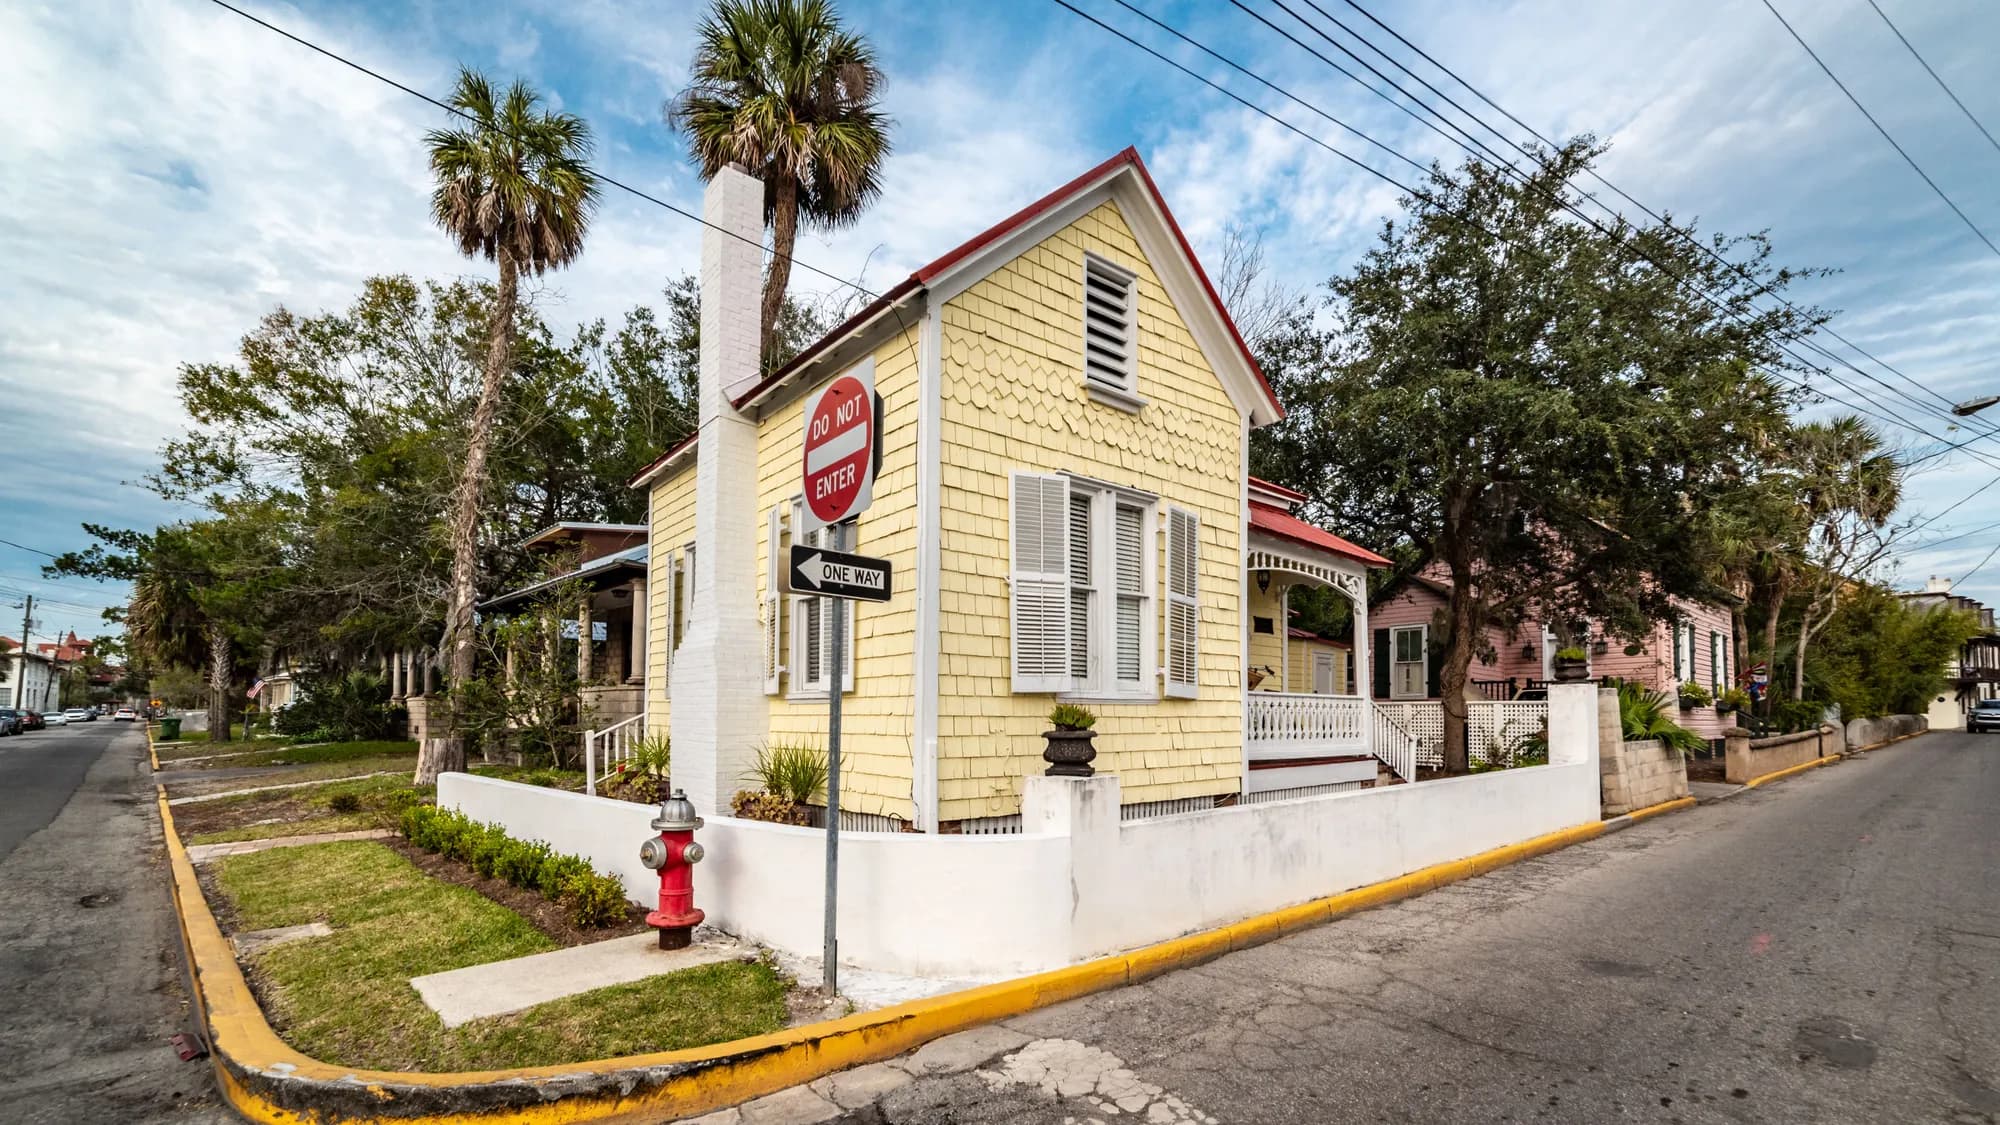
A yellow frame house on a corner lot in St. Augustine, Florida

From $29/mo · For Sellers

The Listing Line

Where should I list, and what does each price cost me?

What an informed buyer in your ZIP will anchor to, and what every week above that number does to your days on market. It does not value your house. It shows you what the market will argue.

What you give it

  • The property address or ZIP code
  • The price you are considering
  • Condition
  • Whether you want speed or the number

What comes back

  • What an informed buyer will anchor to, line by line
  • What to give instead of dropping the price
  • The next few months, and the next few years
  • The trap on your side of the sale
Low-rise seaside apartment buildings under palms in Hollywood, Florida

From $79/mo · For Investors and rental owners

The Deal Line

Does this deal work, and where is the exit?

The entry band on a specific property, the short view and the long view, and the plain math on both. Including the parts that argue against the deal, and the places where the data does not exist to answer you.

What you give it

  • The property address or ZIP code
  • The price they are asking
  • The rent and the monthly costs you expect
  • How long you would hold it

What comes back

  • The entry band, line by line
  • What the rent has to cover, and what it does not
  • The exit, and what it depends on
  • Where the data runs out, said plainly

What these are not

Not an appraisal, not a CMA, not a valuation

There is no automated valuation model here, no comparable sales data below metro level and no listing feed. The range in a paid report is anchored to a price you supply, and it describes what the published market data supports given that number. That is analysis of a stated price.

When an area has too few listings to read honestly, no range is published at all. The report prints the inputs and says why it stopped. A range invented from three listings would look exactly as confident as a real one, and you would have no way to tell them apart. How the range is built.

Start with the free one.

A Market Brief on your area costs nothing and takes about a minute. If it is useful, the paid reports run the same math on a specific house.